This learning process is quite developed in humans, making us the most intelligent species on the planet. The constant pursuit of learning has enabled us to devise various tools, “data science” is one such tool. We can consider these techniques as analogous to the learning process of humans described above.
Data science is a study, where we apply our previously acquired knowledge of different domains such as computing, machine learning, statistical learning, mathematical sciences, finance, business, and engineering. In order to find patterns in the “data” which enables us to arrive at a conclusion, helping us forecast the future behavior of the data. Learning from data to predict it’s future behavior is what can be said as a simplified and generalized objective of data sciences.
You can start data science as a career offers a plethora of learning and earning opportunities. In order to master data science, one needs a solid understanding of algorithms, mathematics, scientific methodologies, and software development. So consider enrolling in our industry-recognized data science course and surge ahead to start Data Science as a career.
Table of Contents
How to Start Data Science as a Career
Data science is an interdisciplinary field and its presence is virtually everywhere, from health-care to space technology. Opportunities are ubiquitous for Data science professionals, today in the Software Industry, Data Science professionals pocket the highest salaries when compared to their Software counterparts. Owing to these facts, Data Science professionals are always on demand. To become a Data Science professional, you need to enroll in an industry-certified data science course and broaden career horizons.
Data Science Life Cycle
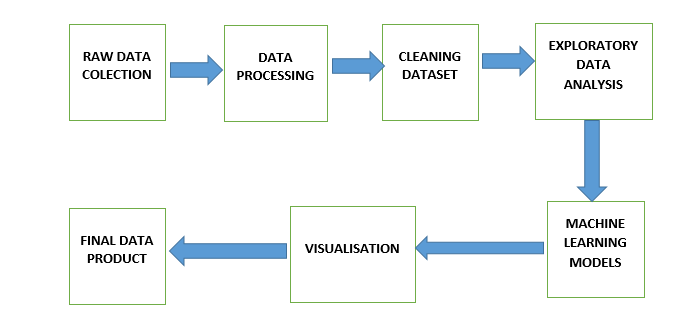
Data Science life cycle comprises of various stages, with each stage having its own technical complexities and importance.
Stage 1: Problem Identification
The first stage of the data science cycle is to identify the problem. We can’t proceed if we don’t know what we are trying to solve. Problem formulation is where it all begins. The problem can be diverse in nature and can contain multiple aspects to it.
Stage 2: Data Acquisition
Data Science being a multidisciplinary field derives its data from various disciplines such as finance, engineering, economics, biology, politics, etc. It becomes useless, if we don’t have any data, so the second stage is data acquisition. In the data acquisition phase, a Data Scientist would employ APIs to pull the data from various sources, his/her main concern is to acquire as much data as he can, because the larger the amount of data, the more accurate his analysis is going to be. This stage of data acquisition is where data science begins.
Stage 3: Extraction and Cleaning
The third stage in the development process of data science involves the extraction and cleaning of useful data from available data. This is a very important aspect as properly refined data can reduce our computation cost and exponentially. That will increase the probability of getting accurate results. Technically this can be said as the refining process, where the useful ones are kept and the useless are discarded. Real-life data contains lots of noise (noise means anything we don’t need). Analogically speaking, we can say while if we are analyzing the stock market data to find patterns of FMCG Company. We will remove the data from automobiles from our list.
Stage 4: Pattern Recognition
Then comes the stage where things would start getting interesting “Application of machine learning algorithm on the refined data”. Here we try to find a pattern by applying various machine learning algorithms. Pattern recognition is the most important aspect of data science. There are various machine learning algorithms developed which can be broadly grouped as follows.
Machine learning and deep learning algorithms amplified by modern computing power help us find a pattern in the extracted data. That is to say, Making use of this advanced technology gives us meaningful insights from data.
Stage 5: Data Visualization
The next phase is a data visualization. It involves visualizing the collated data. What we do here is represent the data in graphical forms. The objective of this stage is to analyze the data and turn it into graphs as they easy to infer.
Here we use various tools to convert analysis into meaningful graphs.
The advancement in computing hardware and software has empowered us with some of the best tools to perform a variety of actions. The powerful computing languages like Python have various specifically targeted libraries like matplotlib (https://matplotlib.org/). It provides data-scientist powerful tools to convert raw data into graphical forms. Research or analysis is as good as its ability to present itself to the audience in the simplest possible manner. This applies to data sciences as well.
The results or speaking in technical terms “prediction” should be presented in the simplest possible manner. Here we are presenting mathematically and algorithmically deduced analysis to people working in their respective domains. They may not have the ability to study the technical details. So we keep it as simple as possible.
Pictorial Representation

Enroll in Data Science course to Get Certified
You can broaden your career prospects by enrolling in one of the best industry-focused Data Science course. After taking the courses, you will have a solid knowledge of Data Science concepts and stand out from the crowd by getting certified. As a result, you will definitely preserve lots of opportunities for working on industry-recognized projects.


