You have already used some of the basic listeners such as view results Tree and View Results in Table along with Assertion results on the previous tutorials. In this tutorial, you will get more detail along with the examples of using the common types of JMeter listeners.
Table of Contents
Types of JMeter Listeners
Following are the most common types of JMeter listeners. They are used to view the JMeter test results in various ways.
1. View Results Tree
The View Results Tree listener displays the results in the form of tree generated from different samplers and assertions of JMeter. This listener displays corresponding samplers along with different parameters and data for each results. For example, if you are using HTTP sampler request it will show the parameters such as sampler result, request and response data.
Use the following steps to add this listener on the JMeter test plan. At first, right-click on Thread Group name, select the option Add>Listener and click on View Results Tree. Following screenshot shows the sampler results for HTTP sampler request on View Results Tree listener.

2. View Results in Table
It was the another mostly used listener in JMeter. As the name suggests that View Results in Table listener shows the results of each sampler in tabular format. The results table shows columns having starting time, thread name, label, sample time, status, bytes, sent bytes, latency and connect time.
Use the following steps to add this listener on the JMeter test plan. At first, right-click on Thread Group name, select the option Add>Listener and click on View Results in Table. Following screenshot shows the test results in a table for HTTP sampler request on View Results in Table listener.
3. Assertion Results
The assertion results listener displays the results of samplers that uses assertions. This listener shows all the failed assertions related to each samplers. You can also add this listener same as adding other listeners previously mentioned. Following screenshot shows the assertion results along with failed assertions.

To get more detail about using assertions and viewing results with assertion results listener refer to the previous tutorial written on JMeter Assertion.
4. Aggregate Graph
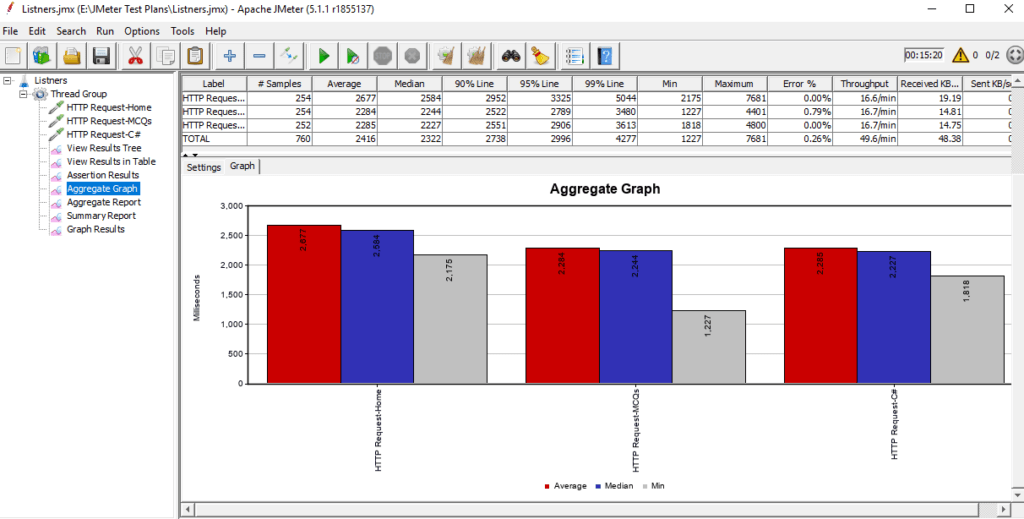
The aggregate graph listener generates the bar graph for each sampler after executing the JMeter test plan. You can set which columns to display on the graph with selecting or deselecting the options such as Average, Median, Min, Max, etc. from setting tab. Following screenshot shows the aggregate graph with three bars Average, Median, and Min for each HTTP sampler request.

You can save the generated graph on the different image formats “.tif” and “.png” with clicking on Save Graph button on the settings tab. It also allows you to save the table data on the “.csv” format going through “Save Table Data” button.
5. Aggregate Report
The aggregate report listener generates the aggregate report in a tabular format. It shows the aggregate data of each sampler request on the single row. The results table shows columns having aggregate data of Average, Median, 90% line, 95% line, 99% line, Min, Maximum, Throughput, etc. The following screenshot shows the aggregate report of each HTTP sampler request along with the total/aggregate value among all sampler request.

This listener also allows you to save the whole table data. You can do it clicking on “Save Table Data” button located at the end of the screen.
6. Summary Report
The Summary Report listener generates the report similar to the report generated by the aggregate report. The summary reports table shows columns having aggregate data of Average, Min, Max, Std. Dev., Throughput, Sent, Received and Average Bytes, etc. The following screenshot shows the summary report of each HTTP sampler request.

Summary report listener also allows you to save the table data and browse the existing summary report data.
7. Graph Results
The graph results listener generates the graph in real time for each sampler while executing the JMeter test plan. If you run the test for a longer time with making loop count forever on thread group properties. You can clearly observe the graph results over time. It can be set to display on the graph results screen. You can show or hide Data, Average, Median, Deviation, and Throughput on the graph each of them is represented with different colors. Following screenshot shows the graph results with displaying Data, Average, Median, Deviation, and Throughput of each HTTP sampler request.

Along with these common types of JMeter listeners described above. There are other listeners also available on JMeter which are backend listener, comparison assertion visualizer, BeanShell listener, JSR223 Listener, simple data writer, Response Time Graph, Mailer Visualizer, Generate Summary Results, etc.


