Capturing and reading browser logs helps the developers to find the source of the problem. Generally, the browser log includes different components such as process ID, thread ID, date, time, source code file name along with line number.
Table of Contents
Collecting Browser Console Logs from Different Browsers
Here is the step by step guide for collecting browser console logs from the main browsers Google Chrome, Mozilla Firefox, Internet Explorer and Microsoft edge.
Google Chrome 67
1. Opening the Console
In order to open the console window perform the steps given below.
- At first, right click on web browser window and left click on inspect element.
- Click on console tab.
OR
- Click on the hamburger menu icon (3 dots).
- Click on More Tools.
- Now, click on Developer Tools.
OR
- Directly press Ctrl+Shift+I for windows and Cmd+Option+I key from the keyboard.
2. Selecting the settings
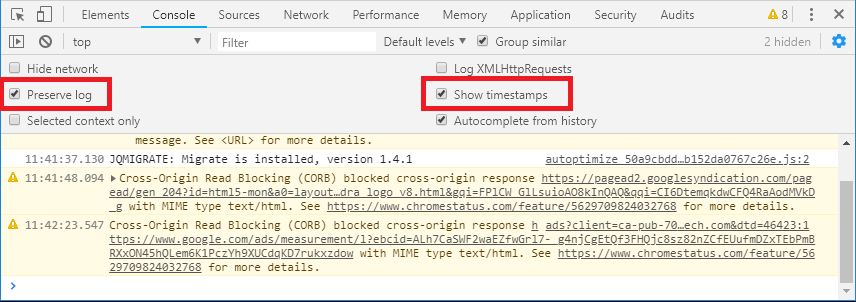
Now you have to select the required settings for capturing the logs.
- Click on settings icon to open settings option.
- Select preserve log.
- Select show timestamps.

3. Starting to record log
- Clear the logs with clicking on circle icon or press Ctrl+L key
- Start to recreate the issue you have found.
4. Saving the log
- Highlight all the log text with pressing Ctrl+A for windows or Cmd+A on Mac.
- Right-click over the log screen and click on Save As.
- Give the name of the file and save as text file with providing .txt file extension.
Mozilla Firefox 61
Mozilla Firefox provides two interfaces i.e web console and browser console, for capturing browser console logs. Basically, web console is useful for recording browser console logs from a single page since it is limited to a single page. Whereas, browser console can be used to capture browser logs from all the tabs.
Capturing logs using web console
1. Opening web console
- Open options menu (three lines on the top right corner).
- Click on Web Developer and click on Web Console OR directly press Ctrl+Shift+K key.
OR
- At first, right click on web browser window and left click on inspect element.
- Click on console tab.

2. Recording logs
- Give check mark on “Persist Logs” checkbox.
- Click on three dots and click on settings or press F1 key.
- Give check mark on “Enable timestamps” checkbox located under Web Console session.
- Start to recreate the issue you have found.

3. Saving logs
- After finished recording, right click on console area and click on Select All OR directly press Ctrl+A key.
- Now copy the content pressing the Ctrl+C key and paste it on the text editor like Notepad.
- Save the log as a text file.
Capturing logs using browser console
- Open options menu (three lines on the top right corner).
- Click on Web Developer and click on Browser Console OR directly press Ctrl+Shift+J key.
- Start to recreate the issue you have found.
- Save the captured log as the method given above.
Internet Explorer 11 / Microsoft Edge 20
1. Opening web console
- At first click on Tools icon located on the top right corner of the window.
- Click on developer tools OR directly press F12 button.
- Click on console tab.
OR
- At first, right click on web browser window and left click on inspect element.
- Click on console tab.

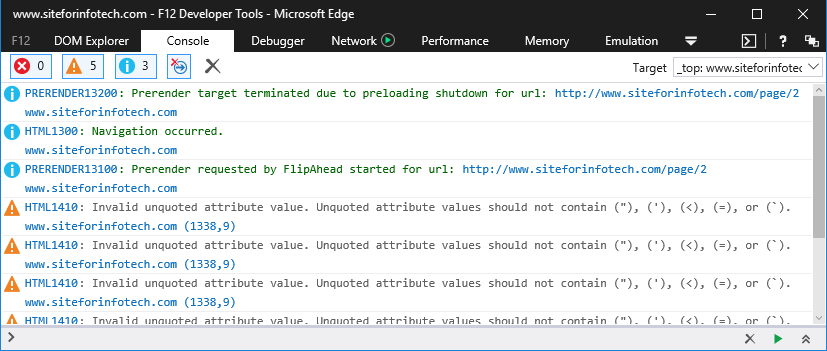
2. Recording logs
- Clear the previously recorded logs clicking on (X) icon.
- Start to recreate the issue you have found.
3. Saving logs
- After finished recording, right click on console area and click on Copy All.
- Paste the copied log text to Notepad and save as text file.
Read Next: How to Capture Android Logs with Minimal ADB and Fastboot


